This article explains how to show, hide, and edit the three main axes (X, Y, and Z) in an Excel chart. We'll also explain more about chart axes in general. Instructions apply to Excel 2019, 2016, 2013, 2010; Excel for Microsoft 365; and Excel for Mac.
To hide one or more axes in an Excel chart:
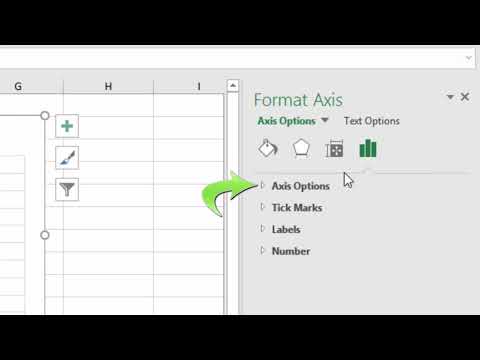
Select an empty area in the graph to display the graph tools on the right side of the graph.
Select Chart Elements and the plus sign (+) to open the Chart Elements menu.